One of the most puzzling questions we get from customers who run Facebook Ads and want to analyze their website traffic, is why there’s discrepancies between Facebook Ad clicks and Facebook Pixel fires aka website visits.
This is where Landing Page views come in, since they’re the closest metric you can use in Facebook Ads Manager reporting to track your website visitors.
In many cases, we’ve heard (and experienced first-hand) up to a 50% drop-off between Facebook Ad clicks and Landing Page Views 🙈. So what causes this discrepancy? And how can you optimize your ads for more website visitors?
We’ll break things down into 4 parts, so you have everything you need to know about Clicks vs. Landing Page Views:
- 🚦 The difference between Clicks and Landing Page Views & why to use the latter when analyzing website traffic
- ️ Common reasons for discrepancies between clicks and website visits
- 📊 How to create ad reports with Landing Page Views
- 🔬 Tools to optimize your traffic & analytics
Facebook Landing Page views vs Link Clicks
To start, let’s walkthrough a quick refresher on 3 different click metrics Facebook provides. Note: for each of the metrics below, you can also view unique clicks.
1. Clicks (All): This is the total number of clicks on your ads. Seems simple by definition, however, the main callout is that it also counts any actions on the ad itself, including:
- Link clicks
- Clicks to the associated business Page profile or profile picture
- Post reactions (such as likes or loves)
- Comments or shares
- Clicks to expand media (such as photos) to full screen
- Clicks to take actions identified as your campaign objective (such as liking your Page for a Page engagement campaign)
Use All Clicks to understand general engagement on your ads and testing creative, but not for tracking website traffic.
2. Link Clicks: This is the total number of clicks on links within the ad that led to destinations on or off Facebook (websites, Facebook lead forms, videos on YouTube, etc.). If you include Instagram as a placement, for “ads promoting Instagram profile views, link clicks include clicks on the ad header or comments that led to the advertiser’s profile.”
Link Clicks filter out some of the noise so you get a closer metric on clicks leading to your website, but again it won’t be accurate since it still includes clicks to Facebook destinations.
3. Outbound Clicks: These are the total number of clicks that lead people off of Facebook to your website or app. Facebook mentions that “while some traffic might drop off between an outbound click and a webpage view, outbound clicks give you a closer approximation of the traffic intended for your website or app.”
Between the 3 click metrics, Outbound Clicks is the closest one for gauging traffic to your site, but it’s still inaccurate as it doesn’t capture landing page loads.
So this of course brings us to Landing Page Views ⚡.
From Facebook: “Landing page views let you know how many times people loaded your website, after clicking your ad. You can compare landing page views to link clicks to understand how many people clicked on your ad but left before your website loaded. To report on landing page views, you must have created a Facebook pixel.”
The most important takeaway, is that of all the metrics above, Landing Page Views is the only one that counts when a user loads a webpage after clicking an ad, since the pixel fires any of these events: PageView, PixelInitialized or ViewContent (PageView and PixelInitialized are automatically captured by the Facebook Pixel).
So for truly monitoring how effective your ads are at driving people to your website, use Landing Page Views 🙌.

What causes discrepancies between Facebook Ad clicks and landing page views
Facebook doesn’t fire a pixel upon every click, which means not all clicks result in landing page views. Why not?
- 📃 Slow page loading: This is the most common issue. Especially on mobile, if a page takes longer than 3 seconds to load, over 50% of users will abandon the site.
- 📱 Clicks that didn’t lead to your site: If you’re comparing website visits using Facebook’s click metrics, remember that it’s inaccurate as none of them count website page loads. Some of them also count clicks as actions on your ad (liking the ad etc.) or clicks that lead to other destinations on Facebook. This means the number of clicks will likely be higher than the actual number of landing page visits.
- 👆 Multiple clicks from one person: The Facebook Pixel typically fires per unique user vs. per click. So if the same person is clicking on your ad multiple times in a short amount of time, it likely won’t fire each time that person loads your landing page.
- 😤 Accidental clicks: Sometimes a person might be viewing an ad, click accidentally (especially on a mobile device), and then press back or close the page before it loads.
If you’re running link retargeting campaigns using PixelMe, read this FAQ on why the number of clicks in your PixelMe analytics may appear differently than in your ads platform.
How to create custom Facebook Ads reports with Landing Page Views
On top of updating your standard Facebook Ads reporting to include Landing Page Views, you can also include more click metrics such as Link Clicks & Outbound Clicks. Then, breakdown your clicks and landing page views by “Platform & Device”, “Placement & Device”, and more.
This gives you a view of which devices, platforms, and placements people are clicking and landing on your website from, and helps you understand if there’s certain paths with a greater drop-off that you need to optimize.
Steps to create a report with custom columns
- Visit Facebook Business Manager and go to your Ads Manager account.
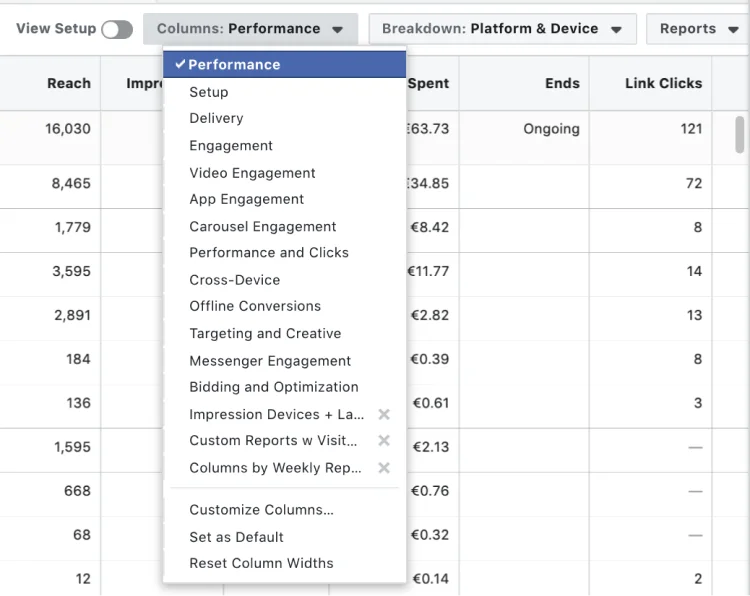
- From the Campaigns tab, click on the top right drop-down for “Columns” and select “Performance”.
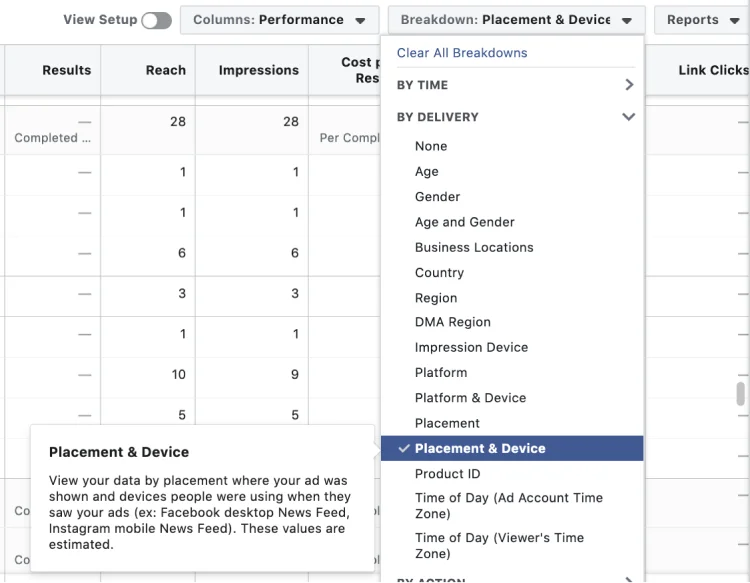
- Next to “Columns”, click on the “Breakdown” drop-down and select “Placement & Device”. Pro tip: you’ll find a whole list of other ad delivery breakdowns you can filter by.
- Go back to the “Columns” drop-down, and click on “Customize Columns” at the bottom.
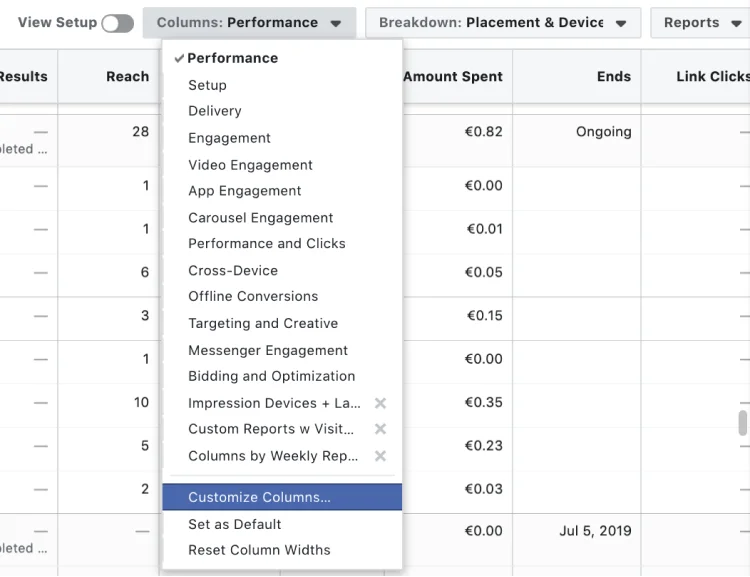
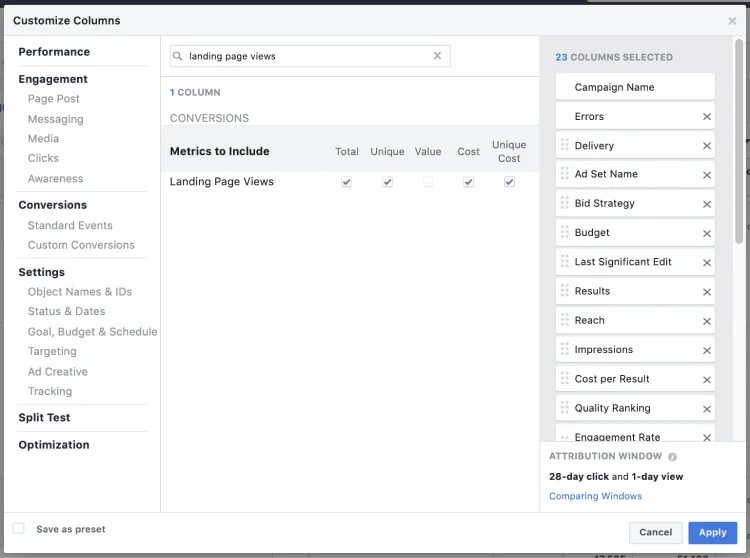
- In the Customize Columns modal, enter “landing page views” in the search bar, and then check off all the Landing Page Views metrics you’d like to see. Select from Total, Unique, Cost, and Unique Cost. Then hit Apply.
💪 Pro-tip: You can repeat this step to include “Link Clicks” and “Outbound Clicks” and arrange your columns on the far right by simply clicking and moving them up or down. Or, remove any by clicking on the ‘x’.
- Finally, click on the Columns drop-down again, and next to “Custom” click Save to create a new report you can toggle anytime. Or, simply click “Set as Default” at the bottom.
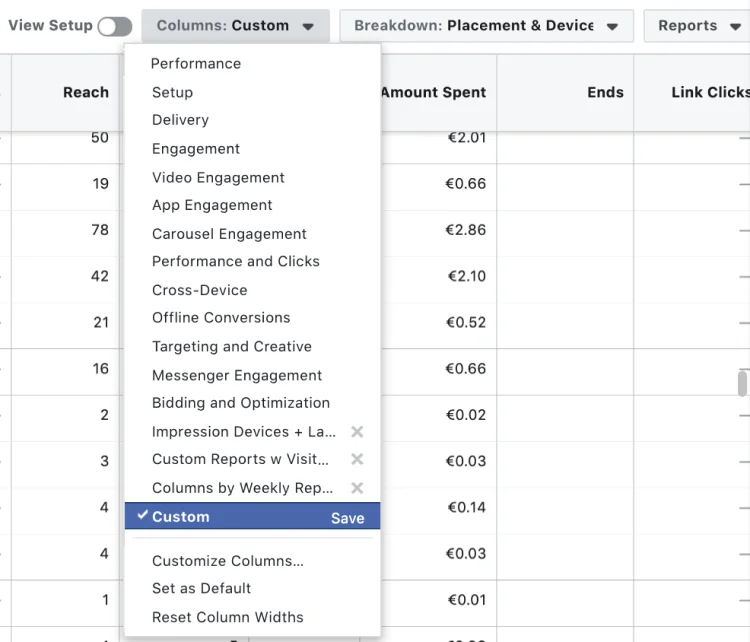
And you’re all set! 🔥
Now you have a new report that includes columns for Link Clicks, Outbound Clicks, Landing Page Views, all the different Facebook placements (Facebook, Instagram, Messenger, Audience Network) and devices people are using (Android, iPhone, Desktop, iPad, etc.).
Tools to optimize your Facebook Ad analytics
When it comes to analyzing your ads and results, getting people to take actions that you care about is what matters in the end. So you can see why for boosting traffic, Landing Page Views let you track how effective your ads are at getting actual website visitors.
To help you keep improving your Facebook Ads reporting and increasing traffic, we’ll close off with our top 4 tools 🎯.
1. Landing Page Views Optimization
When launching a Facebook campaign with the Traffic objective to get people to your site, ensure you optimize your ads for Landing Page Views and not Link Clicks.
This will tell Facebook to show your ads to people likely to click through and view your landing page, and should increase the quality of your audience.

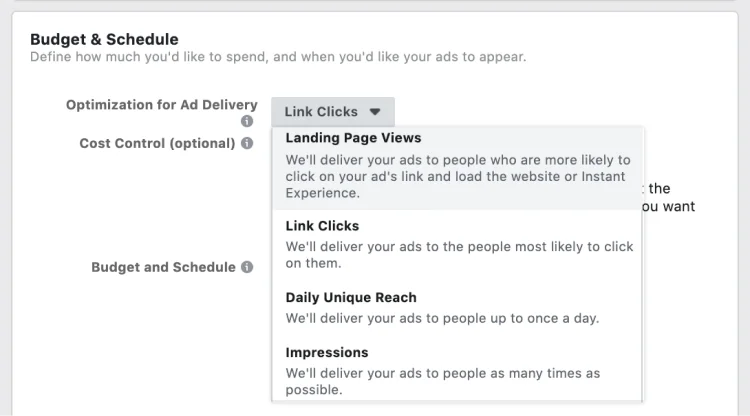
- From Business Manager, create a new campaign, and select Traffic as the objective.
- From your Ad Set, under Budget & Schedule, select the drop-down for “Optimization for Ad Delivery”.
- Then, select “Landing Page Views”.
2. Facebook Pixel Helper
The Facebook Pixel Helper is a fantastic Chrome Extension to check that your Facebook Pixel is setup correctly on your website and firing events.
For every Pixel event you’re tracking (e.g. purchase, complete registration, signup), it’ll show each event along with details, such as warnings, errors, and successes.
Facebook for Developers has a great Pixel Helper guide with troubleshooting tips.
3. GTmetrix Website Speed Test
💨 Use GTmetrix to check how quickly your homepage and other landing page destinations from your ads are loading. If your page loads longer than 3 seconds, this may be a likely reason why you’re seeing a big drop-off from clicks to visits.
GTmetrix is completely free and lets you enter in any URL, then shows your average page load time, page size, and a list of specific recommendations on how to optimize the page.
4. Smart Attribution
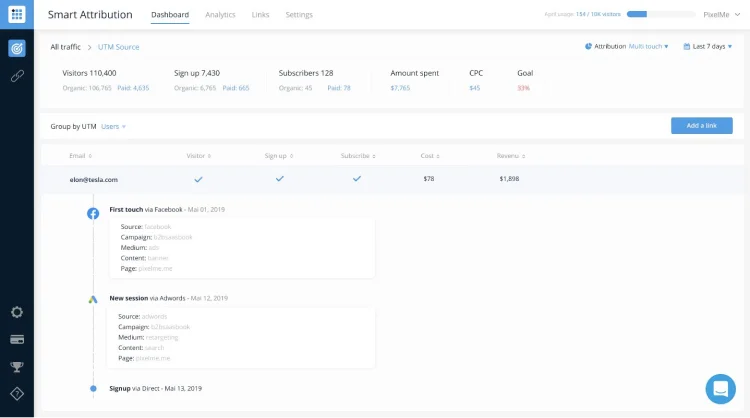
Our new Smart Attribution solution was built to tackle the biggest struggle we heard from customers – automatically tracking ROI across marketing channels. It lets you:
- 🔥 Measure ROI across ad platforms (Facebook & Google) and non-paid channels.
- Identify every visitor touchpoint that led to a conversion.
- 👆 Understand how your Facebook Ads fit into your customer journeys, from discovering your business to converting. Compare first touch, multi-touch, and last touch attribution models.
Want to track your Facebook Ads ROI? Sign up for a free 7-day PixelMe trial 🎉. Or send us a message from the chat icon in the bottom right-hand corner! 💬
To get more marketing tips like in your inbox, subscribe to our Carbon6 newsletter
